(adsbygoogle = window.adsbygoogle || []).push({ google_ad_client: "ca-pub-8679583308408160", enable_page_level_ads: true });

Friday, May 31, 2019

Lowest trade commission

I think is a form of great saving to cut down on the trade comm to pay for each trade/transaction.

Normal cash account is charging online at min $25 or 0.28%.
This is rather expensive as compared to using cash up front account of min $10.00.


Personally I have 3 cash up front account from Dbsv ,Standard Chartered and Fsmone .Min comm is $10.


If you prefer the share to be credited to CDP account then dbsv upfront cash is the best option to choose.

I just collected my rebate from Dbsv $134+(last quarter) for cash account.

I think I can safe a lot from using fsmone for selling those share from cdp .It just take a little bit of effort to open the account and have it link to your CDP account .Is just that simple.

Fsmone comm is min $10 or 0.088%. This is a vast different from min $25 or 0.28%.


I am just sharing the good way to safe some money on lowering down your trade comm.

If I done 20 trades a month. I can safe an extra comm of about $300(20 x $15).

Pls dyodd.


SingTel

TA wise , looks bullish!
Last Friday opening price at 3.16 and managed to close higher at 3.20 coupled with quite a high volume looks rather positive!

A 5.6m buying up at 3.20 during closing looks like fund is loading up!


With the several goods news flowing in for overseas associate SingTel is looking good to boost their revenue and net profit level.

Dividend of 10.7 cents going ex-dividend on 26th July may attract some buying activities.


I think a Gap up may likely happen and take it higher towards 3.28 and above .

Huat ah!

Pls dyodd.


SingTel is yielding a yield of 5.6 percent. With regional associates’ earnings beginning to rebound after two years of decline led by potential reduction in losses at Bharti, I think Singtel has the potential to maintain in paying out the dividend of 17.5 beyond 2020.

TA wise, the current price of 3.15 is gaining strength and may likely reclaimed 3.20 level and rises further towards 3.28 and above!


With its 50 days moving average crossing over its 200 days moving average this is rather positive!

Telco is also quite a resilient counter during market volatility.

Not a call to buy or sell.

Pls dyodd.


4th quarter results came in quite stable at 766.9m comparable to last year 767.9m.

Final Dividend of 10.7 cents has been declared.
Ex-dividend on 26th July and payout date on 15th Aug. 
Full year dividend of 17.5 cents is nice.


FCF is healthy at about 3.65b which is sufficient to cover the Dividend payout if about 2.8b.

TA wise, looking good to re-attempt 3.20 level.
Crossing over smoothly plus good volume that may drive the price higher towards 3.28 and above.


The company has started to buy back share yesterday of 437,333 share at 3.11-3.12 , looks positive.
Long time didn't see company buying back share.

Not a call to buy or sell.


Pls dyodd.

CapitaLand

Chart wise, looks rather bearish!
Likely to continue to trend lower.

A deadcat bounced situation has happened when it touches the low of 3.22 and managed to rise higher to hit 3.33.


It has weaken again and went down to close at 3.22. Looks rather negative!

Short term wise,
I think it may likely breakdown 3.22 and continue to slide down to test 3.10 level with extension to 3.00.


Not a call to buy or sell.

Pls dyodd.


Keppel Corp

TA wise, Super bearish!
I think high chance to go below 6.00 and retest 5.78 then 5.67 with extension to 5.50 .


Pls dyodd.

18th May 2019
Last Friday it has broken down the recent low of 6.38 coupled with quite a high volume ,looks rather bearish!


The current price of 6.34 is staying below it's SMA lines looks rather negative and may likely continue to trend lower.


Short term wise, I think it may likely go down to retest 6.20 then 6.00 with extension to 5.80 level.

Not a call to sell or buy.


Pls dyodd.

Thursday, May 30, 2019

STI ETF


I think is almost good time to revisit this STI ETF as can be seen from the chart, RSI has driven into oversold territory that is below 20. 


PE is about 11.14x  which is still undervalue as the historical average PE is about 15x.
Dividend yield of about 3+%.


When is the Best time to lock in profit is when the RSI is over 70 and the PE is more than 20.


Not a call to buy or sell.

Pls dyodd.

I think good investing does not require too many fanciful ideas and strategies. Just one simple no-brainer strategy that can work effectively through time and allow us to sit back and relax to enjoyr the reward of the investment that is working effortlessly to achieve our investment goal of getting 8-10% gain( passive income).

This simple strategy is to invest in a low cost ETF( Exchange Traded Fund)  such as the STI ETF (ES3.SI) or NIKKO AM STI ETF(G3B.SI) 

This method of operation is to buy into STI ETF whenever it is in an oversold condition
 and to 
sell off and take profits whenever it is in an overbought condition. 

For example, one may use the  indicator such as the Relative Strength Index (RSI) to determine overbought ( above 70 ) or oversold condition( below 30).


One may plan to buy and selling of units in several batches whenever in oversold or overbought conditions in order to get the best average price.

For example you may plan to buy in at different interval or whenever the Oversold situation happen .

In any one year, there will be three to four such window opportunities of overbought or oversold conditions to operate by buying or selling units of the ETF. At the same time, we can also kept some units always to receive dividend income and for their long term growth in price appreciation.

With discipline and patience , one should be able to get good average returns per year in excess of certain % by this one simple strategy of investing in one single ETF .I think This simple one strategy is safe and allow one to sleep soundly at night without worry of negative news affecting individual stocks in one's portfolio which could crash the share price of the particular stock the next day. This is because even if one or two of the component stocks in STI ETF of blue chips should collapse in share prices, there will be 28 others to diversify away the risk of the entire portfolio collapsing at anytime.

As for younger folks who just started out working and does not have enough cashflows and savings , one may start to spread out the different batch of buying or applying the Dollar-cost-averaging method by investing $1000 at 6-8 different batches that would be able to achieve  lower average costs per unit. 

the example are as follows:-

1. When the index price is $2.00, your $1000 will be able to buy 500 shares.
2. When the index price is $2.50, your $1000 will be able to buy 400 shares
3. When the index price is $2.90, your $1000 will be able to buy 344 shares
4. When the index price is $1.66, your $1000 will be able to buy 625 shares
5. When the index price is $3.00, your $1000 will be able to buy 333 shares
6. When the index price is $3.20, your $1000 will be able to buy 312 shares
7. When the index price is $3.50, your $1000 will be able to buy 285 shares

Total = $7000 / 2799 shares = $ 2.50 average cost per unit.

By using this method, you will be able to make a profit once the stock market rises above this low average price.

RSP :

Just sharing.

Not a call to buy or sell.


Please do your own due diligence.

Wednesday, May 29, 2019

Valuetronics

TA wise, looks like a reversal chart patterns!
It has managed to bounce-off from 59.5 cents to hit the high of 63.5 cents, looks positive!


Short term wise I think it may lijeli move up to test 65 then 70 with extension to 75 cents.

NAV 45 cents.
Zero debts.
Net cash per share 37 cents.
PE below 8.

Dividend of HKD 20 cents = S$0.035.
Interim dividend of HKD 5 cents.
Yield is 7+%.

Not a call to buy or sell.
Pls dyodd.

Tuesday, May 28, 2019

SGX

Looks like all the hard work is gone!
Today price dropped 20 cents to close at 7.42 , looks rather bearish!


Short term wise, I think the price may consolidate or move lower to retest 7.35 then 7.30 level.


Is good to be cautious and wait for price to stabilize first !

Not a call to buy or sell.

Pls dyodd.


Sunday, May 26, 2019

Valuetronics

TA wise, looks super bearish!
Last Friday it has managed to bounce-off from the low of 59.5 cents and close higher at 61 cents, looks like it is able to stay above the 60 cents crucial Support level. Failure which, it would be quite critical.


Short term wise, I think we may see a technical rebound . After this rebound, it it is still unable to hold above 60 cents level then it may likely go further down to revisit 56 cents with extension to 50 cents level.

The company would be announcing its FY result on Wednesday - 29th May 2019 before trading commence. I think all eyes will be waiting to see how the results fare for the Final quarter!

NAV 0.446.
Dividend of 3.7 cents.

Not a call to buy or sell.

Pls dyodd.


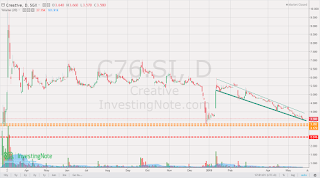
Creative

TA wise, looks super bearish!
Looks like it is having a one-way ticket to the South pole!

After hitting the high of 10.00 on March 2018, it had since corrected sharply and went down to close at 3.60 last Friday - 24th May 2019, Looks rather negative and may likely go down to retest the previous Low of 3.28.


The chart it telling us that the price has more room to go lower.
Short term wise, I think breaking down of 3.28 may likely go further down to revisit 3.17.
If 3.17 fails to hold which was also the pivot low when the price Gap up from the 1.00 price level, this may signify more drastic selling down pressure and may likely go down to retest 2.50 level.

NA 2.144.
The company would still be in the Red if not because of the litigation settlements.

Not a call to buy or sell.

Pls dyodd.


Friday, May 24, 2019

Sph

Last Friday we have witnessed the spike up of the share price from 2.32 to 2.39 and close well at 2.39 ,coupled with quite a high volume this is rather bullish!


A white soldier appeared in the chart. Looks rather positive and we may want to take the opportunity to ride on this Long wide Bullish bar !

Short term wise, I think it may likely retest 2.45 then 2.50 with extension to 2.55 

Not a call to buy or sell.

Pls dyodd.


SingTel

SingTel is yielding a yield of 5.6 percent. With regional associates’ earnings beginning to rebound after two years of decline led by potential reduction in losses at Bharti, I think Singtel has the potential to maintain in paying out the dividend of 17.5 beyond 2020.

TA wise, the current price of 3.15 is gaining strength and may likely reclaimed 3.20 level and rises further towards 3.28 and above!


With its 50 days moving average crossing over its 200 days moving average this is rather positive!

Telco is also quite a resilient counter during market volatility.

Not a call to buy or sell.

Pls dyodd.


4th quarter results came in quite stable at 766.9m comparable to last year 767.9m.

Final Dividend of 10.7 cents has been declared.
Ex-dividend on 26th July and payout date on 15th Aug. 
Full year dividend of 17.5 cents is nice.


FCF is healthy at about 3.65b which is sufficient to cover the Dividend payout if about 2.8b.

TA wise, looking good to re-attempt 3.20 level.
Crossing over smoothly plus good volume that may drive the price higher towards 3.28 and above.


The company has started to buy back share yesterday of 437,333 share at 3.11-3.12 , looks positive.
Long time didn't see company buying back share.

Not a call to buy or sell.


Pls dyodd.

Apac Realty

1st Quarter 2019 result - announced total revenue of S$77.4 million for the three months ended 31 March 2019 (“1Q FY2019”), compared to S$105.2 million in the previous corresponding period (“1Q FY2018”).


The decline in the Group’s revenue was primarily due to a decrease of S$17.4 million or 25.4% in brokerage income from resale and rental of properties to S$51.0 million in 1Q FY2019, and a decrease of S$10.2 million or 29.9% in brokerage income from new home sales to S$23.9 million in 1Q FY2019. With the decline in revenue, cost of services decreased S$24.4 million or 26.4% to S$67.9 million in 1Q FY2019. As a result, the Group recorded gross profit of S$9.5 million in 1Q FY2019, approximately S$3.4 million or 26.5% lower compared to S$12.9 million in 1Q FY2018.

 1Q FY2019 net profit was S$1.7 million, compared to S$5.9 million in 1Q FY2018. The S$4.2 million decline in net profit was primarily due to a S$3.4 million drop in brokerage income contribution as a result of lower transaction volume following the implementation of the cooling measures, and to a lesser extent, higher expenses of S$0.8 million, which includes among others, an increase of S$0.6 million in marketing activities and incentives and S$0.2 million in operating expenses of a new subsidiary, APAC Investment Pte. Ltd.


Outlook:
Commenting on the outlook for the Singapore market, Mr Chua said, “Looking at URA’s quarterly industry statistics, we believe that the property cooling measures implemented by the government in July 2018 have proven to be effective. With the ABSD and LTV restrictions in place, demand for Singapore residential properties will continue to remain weak and we expect the operating environment to remain challenging over the next few quarters.”

“In our endeavor to build a business with sustainable income growth and resilience through market cycles, we looked beyond the shores of Singapore and expanded in Indonesia and Thailand in February 2019. Whilst these businesses are stable and operate in markets of fast-growing economies, rising standards of living, and have an aggregate population of over 335 million, it will take time for us to realise synergies and grow their contribution to the Group,” said Mr. Chua.

APAC Realty has one of the largest brand footprints in Asia with more than 17,700 salespersons in 633 offices across 10 countries through its ERA franchisees. The Group remains well-positioned with a healthy balance sheet and cash balance of S$34.9 million as at 31 March 2019.


The current price of 50 cents seems like value is appealing!

I think the company might be able to payout 3.5 to 4 cents dividend.

I am looking forward for the 2nd quarter result in July/Aug cum dividend announcement of 1.5 to 2 cents dividend.

Not a call to buy or sell.

Pls dyodd.

The price seems to have came down from 62.5 cents after going ex.dividend of 2.5 cents .
It is now trading at 56 cents, that is giving a yield of 7.1% ( base on yearly 4 cents dividend instead of 4.5 ) of which I think is quite an attractive price level.

The company has a healthy FCF as can be seen from the FY2018 financial result.
I think the FCF is sufficient to cover the dividend payout of 4 cents a year.


Debts level seems quite ok at about 0.4% as can been seen from the Balance sheet.
If you take the Loans amount of 57.517m( 2.9 + 54.617) divide by Equity of 143.104m = 0.4% which is considered quite a healthy ratio.

EPS of 6.83 cents.
PE is about 14.5x.
NAV 40.3 cents.


Chart wise, looks bearish!
It is on a downtrend mode chart patterns.
Immediate support is at 55 cents.
The next support level is at 52.5 & 50 cents.

I think current price is trading at an attractive level as the fair value for Apac Realty is about 67 - 73 cents.

Not a call to buy or sell.

Pls dyodd.


Wednesday, May 22, 2019

Raffles Medical

TA wise, looks rather bearish!

Today price has revisited 1.00 and close at 1.01, looks rather negative and may likely continue to trend lower.


The company has started to buy back share today but this is just temporary and may likely see further selling down pressure!

Immediate resistance is at 1.00. Breaking down of 1.00 would be super bearish and likely to retest the previous low of 95.3 cents  then 88 cents with extension to 80.
cents .


NAV 45.5 cents
EPS of 3.8 cents.
PE is about 26x at 1.01.


At 80 cents , PE is about 21x , I think would present quite a good price for me to accumulate.

Not a call to buy or sell.

Pls dyodd.


DBS

High chance 25.40 would not be able to hold and likely to slide down towards 24.00 and below !


Pls dyodd.

15th May 2019
Chart wise , looks bearish!

After going ex-dividend of 60 & 30 cents the price has been corrected more than it's dividend and close lower at 26.29 from the high of 28.64 .


The current price is staying below it's SMA lines and MACd is still trending downward ,the price may likely continue to trend lower.


If the recent low of 25.40 cannot hold up well then it may continue to go down to retest 24.75 with extension to 23.86 level.

Not a call to buy or sell.

Pls dyodd.

Monday, May 20, 2019

AEM

TA wise, looks rather bearish!
The current price of 96.5 cents is staying below it's SMA lines, looks rather negative and may likely go down to retest 90 cents again!


Short term wise, I think it may likely to trend lower!
Breaking down of 90 would be super bearish and may likely go down to 80 cents with extension to 75.

Not a call to buy or sell.

Pls dyodd.


STI

Chart wise, looks rather bearish!
The current STI index is at 3205 is staying below its SMA lines looks rather negative and may likely continue to trend lower.

The 200 days moving average is at 3185. Breaking down of the recent low of 3198 plus going below 3185 would be super bearish!


Short term wise, I think it would likely retest 3198 then 3185 with extension to 3100.

Current market is on a downtrend mode.
Practically downtrend for most of the blue chips counter! Shortist advantage. 


Can wait to collect cheap durians like Capitaland 2.80-3.00, Keppel Corp 5.50-6.00, sgx 6.80-7.00, ETF 2.90-3.00

Not a call to buy or sell.

Pls dyodd.


Saturday, May 18, 2019

Keppel Corp

TA wise, Super bearish!
I think high chance to go below 6.00 and retest 5.78 then 5.67 with extension to 5.50 .

Pls dyodd.

18th May 2019
Last Friday it has broken down the recent low of 6.38 coupled with quite a high volume ,looks rather bearish!


The current price of 6.34 is staying below it's SMA lines looks rather negative and may likely continue to trend lower.


Short term wise, I think it may likely go down to retest 6.20 then 6.00 with extension to 5.80 level.

Not a call to sell or buy.

Pls dyodd.


Friday, May 17, 2019

UMS

TA Wise, looks super bearish!
After hitting the high of 81.5 cents, it has since corrected sharply and continue to go down to touch the recent low of 60.5 cents, looks rather negative .


The current price of 62 cents is staying below its SMA lines such as 20,50,100 & 200 days moving average, looks rather weak and may likely continue to trend lower.


Short term wise, I think it may retest 60.6/60 cents.
Breaking down with high volume that may likely see the price sliding down towards 54 cents level with extension to 46.5 cents.

Not a call to sell or buy.

Pls dyodd.


Capitaland

Chart wise, looks rather bearish!
After hitting the high of 3.72,it has since corrected sharply and close lower at 3.33 level.
The current price is staying below it SMA lines and slightly supported by the 200 days moving average at about 3.32 level.


Breaking this 200 days moving average plus the recent low of 3.29 would be super bearish!

Short term wise, I think it would likely re-test 3.29. Breaking down of 3.29 with high volume that may see further selling down pressure towards 3.20 then 3.07 with extension to 3.00.

Not a call to sell or buy.

Pls dyodd.


Thursday, May 16, 2019

SingTel

4th quarter results came in quite stable at 766.9m comparable to last year 767.9m.

Final Dividend of 10.7 cents has been declared.
Ex-dividend on 26th July and payout date on 15th Aug. 
Full year dividend of 17.5 cents is nice.


FCF is healthy at about 3.65b which is sufficient to cover the Dividend payout if about 2.8b.

TA wise, looking good to re-attempt 3.20 level.
Crossing over smoothly plus good volume that may drive the price higher towards 3.28 and above.


The company has started to buy back share yesterday of 437,333 share at 3.11-3.12 , looks positive.
Long time didn't see company buying back share.

Not a call to buy or sell.

Pls dyodd.


Wednesday, May 15, 2019

DBS

Chart wise , looks bearish!

After going ex-dividend of 60 & 30 cents the price has been corrected more than it's dividend and close lower at 26.29 from the high of 28.64 .


The current price is staying below it's SMA lines and MACd is still trending downward ,the price may likely continue to trend lower.


If the recent low of 25.40 cannot hold up well then it may continue to go down to retest 24.75 with extension to 23.86 level.

Not a call to buy or sell.

Pls dyodd.


Monday, May 13, 2019

Wilmar Intl

Chart wise, looks like it is going to reverse this Uptrend mode and head lower!


I think a breaking down of 3.45 may see further selling down pressure and slide down towards 3.40 then 3.30 level and below.

Not a call to buy to sell.

Pls dyodd.


Saturday, May 11, 2019

AA reit

I am looking to accumulate again at 1.32-1.35 level.

Let say the DPU for the next few quarter is also giving a DPU of 2.75 cents, Yearly DPU would be 11 cents.


At 1.35 , yield would be a whopping 8.148%. Seems attractive to me.

I think their past track records can be used as a reference.

Pls dyodd.

2nd May 2019

DPU has increased for the 4th quarter to 2.75 cents versus 2.5 cents . Whole year dpu of 102.5 cents   Yield is 7.218% at the closing price of 1.42.


Ex-dividend of 2.75 cents on 3rd May.

Yield is pretty attractive at 7.2%.
Quarterly dpu payout .

Just collect a bit today at 1.41 for dividend income.


NAV is 1.35.
Gearing is 33.7%.


Not a call to buy or sell.


Pls dyodd.

Apac Realty

The price seems to have came down from 62.5 cents after going ex.dividend of 2.5 cents .
It is now trading at 56 cents, that is giving a yield of 7.1% ( base on yearly 4 cents dividend instead of 4.5 ) of which I think is quite an attractive price level.

The company has a healthy FCF as can be seen from the FY2018 financial result.
I think the FCF is sufficient to cover the dividend payout of 4 cents a year.


Debts level seems quite ok at about 0.4% as can been seen from the Balance sheet.
If you take the Loans amount of 57.517m( 2.9 + 54.617) divide by Equity of 143.104m = 0.4% which is considered quite a healthy ratio.

EPS of 6.83 cents.
PE is about 14.5x.
NAV 40.3 cents.


Chart wise, looks bearish!
It is on a downtrend mode chart patterns.
Immediate support is at 55 cents.
The next support level is at 52.5 & 50 cents.

I think current price is trading at an attractive level as the fair value for Apac Realty is about 67 - 73 cents.

Not a call to buy or sell.

Pls dyodd.


Friday, May 10, 2019

SingTel

Chart wise , high chance it may re-conquer 3.20 level and continue to rise further.
The current price of 3.17 is staying above its 20,50,100 & 200 Moving Average looks rather positive !


Short term wise, I think it would like retest 3.20 level.
Breaking out with ease + good volume that may propel to drive the price higher towards 3.28 then 3.30 with extension to 3.36 .

Not a call to buy or sell.

Pls dyodd.


23rd April 2019
FY 2018 result will be out on 15 May 2019 before market commence!
Can expect final dividend of 10.7 cents .

Huat ah!

It has managed to bounce-off from 3.10 and surge higher to close well at 3.17, looks Bullish!


The current price of 3.17 is staying above it's 200 days Moving Average looks positive and may likely re-captured 3.20 and rally towards 3.28 level! Huat ah!

Pls dyodd.


Yesterday we have witnessed the wide Bullish bar that is engulfing the previous candlestick , looks positive!


Close 3 cents higher at 3.16 coupled with quite a high volume looks pretty healthy/positive.


I think it may likely move up to retest 3.20 level !

Pls dyodd.


23rd April 2019
SingTel it is looking good to re-conquer 3.20 again !


Breaking out of 3.20 smoothly + good volume that may drive the price higher to 3.28!


Pls dyodd.


18th April 2019
After hitting the high of 3.20, it is now taking a breather.
So far, the pull back is pretty healthy!


After this break, I think it is looking good to re-attempt 3.17 then 3.20 and surge higher towards 3.28 and above

Not a call to buy or sell.

Pls dyodd.


10th April 2019
Today SingTel powers up and manage to clear 3.11 level smoothly + high volume and close well at 3.17, looks super bullish!


Finally, the bull is back !

Looking good to retest 3.20 then 3.28 level .

Pls dyodd.

TA wise , looks Bullish!
SingTel is slowly edging higher and managed to hit 3.13 before profit taking place and close slightly lower at 3.11.


Looks healthy and it may likely move up to retest the next level that is 3.20


Breaking out of 3.20 with ease plus good volume that may drive the price higher to 3.28-3.30 level.

Not a call to buy or sell.

Pls dyodd.