TA wise, looks like it is doing a counter trend reversal patterns! Daily chart is showing bullish indication as the current price is staying above it's SMA lines.
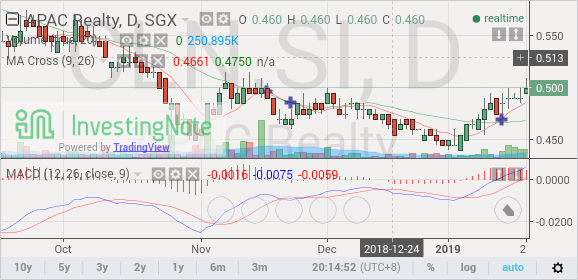
Also MACD is rising up nicely that may likely see price continue to trend higher.
However, weekly chart is still on a downtrend mode direction as can be seen from the chart below.

It is good to be cautious and may be a FIFO basis approach is preferable.
Short term wise, I think a nice crossing over of 50 smoothly+ good volume that may drive the price higher to 55 then 60 cents and above .
EPS is about 7.3 cents.PE is about 6.84x.
Dividend of 4 cents, yield is about 8% looks attractive. Cash on hands of about $52m versus borrowing of $58m. Debts level is quite marginal.
Not a call to buy or sell.
Pls dyodd.
No comments:
Post a Comment