(adsbygoogle = window.adsbygoogle || []).push({ google_ad_client: "ca-pub-8679583308408160", enable_page_level_ads: true });

Saturday, July 1, 2017

Smart Investing idea

Smart Investing idea/method:
1. Buy only somethings that you are familiar with the businesses that the companies that you are going to invest.
2. Don't buy base on tips or impulse!
3. The company must be profitable . Giving at least 2% dividend yield. 
Return On Equity (Net income/total no. Of equity)must be above 8 %, and within max 20%. PE not too high( base on industry average PE).
4. * Cash flow level must be in the pink of health. If not the company may not sustain even if the financial result is showing Hugh profit.
5. Look at their debts level. Debts ratio is often referred to equity to debt ratio.This measure refers to company finance its operations vs. its amount of available For example, a business that has accumulated $50 million in debt and has $200 million in assets has $250 million in available capital. The debt ratio in this example will be .20 or 20percent ($50 million divided by $250 million equals .20). 
When a company approaches 1 to 1 things can become very worry some. It depends on which sector//industry . 
Not sure what is the acceptable equity to debt ratio.
6. Good management. Well established company name/brand.
7. Net Profit/Income Margin - preferable above 10% - 20% ( good profit margin).
Few stock counters being selected for smart investing are for example :
QAF - famous for wide range of Gardenia breads, Australia Airport.Dividend of 5 cents, yield 3.913%
Sheng Siong - local super market. yield of 3.8% ( dividend of 3.8 cents) 
Thaibev - F& B , Thai Beer, Tigher Beer etc.dividend 2.4 cents. yield 2.65%.
Netlink IPO - 4.75 - 5.5%..
Dyodd.
(trade base on your own decision)

Friday, June 30, 2017

CapitaR China Trust


CapitaR China Trust - 30th June 2017

CapitaR China Trust has been gently rising from the low of $1.40 to a high of $1.65 as reflected on the chart. Currently, it is on a nice uptrend mode patterns.


The current price of $1.64 is trading at a PE of 13.6x , NAV $1.576 , P/B 1.04, yield 5.99% seems fairly positive. 

Chart wise fairly positive and may likely see further upwards move prevail.

Short term wise, I think it may likely re-attempt $1.65 . Breaking out with good volume that may propel to drive the share price higher towards $1.70 with extension to $1.80.
not a call to buy or sell.
( trade base on your own decision) 

Thursday, June 22, 2017

SembCorp Ind

SembCorp Ind - 23rd June 2017

After hitting the high of $3.38 on 23rd Feb 2017 , it has since retreated and continue to trend lower to touch 2.97 on 2nd May 2017. This is generally quite bearish.


The current price of $3.03 is trading closed to the support level at $3.00. Once this is being broken down we can expect to see it goes further down towards $2.97 then $2.90 with extension to $2.83.

( trade base on your own decision)

Friday, June 16, 2017

SHENG SIONG

SHENG SIONG - 16th June 2017

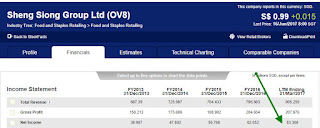
SHENG SIONG has been growing and expanding his business rev/net profit as being reported on its financial report .
I have roughly worked out the DCF Cash flow value of $1.525 taking into consideration the CAGR of 15.51%. Discount factor of 8%.
Let factor in the further discount of 0.85 X $1.525 = $1.295 or let say we compute extra discount at 0.8 x $1.525 = $1.22.

Dividend of 3.7 cents p.a. Yield is about 3.75% ( current price of 99 cents).


Looking into their past 5 years financial results you may notice the Net Income has been gently rising. This is rather a healthy sign.

ROE is growing at a  higher percentage level of  23% (63.3 / 271.8).

Operating Cash flow has also been rising for the past five years:
I think current price of 99 cents still has rooms for further upwards move towards $1.10 then $1.20.
( Trade base on your own decision)

Keppel Corp

Keppel Corp - 16th June 2017

Keppel Corp after hitting the high of $7.23 on 2nd Mar 2017 ,  it has since continue to trend lower and went down to touch $6.30 today. This is rather Bearish.


The current price of $6.31 is staying below the SMA lines + RSI indicator is also pointing downwards of which may provide further indication that the share price may continue to trend lower.

Short term wise, I think it may go down to test $6.20. Breaking down of $6.20 with high volume, that may continue to succumb to selling down pressure and it may move down to test $6.00 with extension to $5.80 .
( trade base on your own decision)

Saturday, June 10, 2017

OUE

OUE - 9th June 2017

OUE Limited is a diversified real estate owner, developer and operator with a real estate portfolio located in Asia and the United States.
OUE Limited (SGX-ST: “OUE”) consistently grows its business by leveraging its brands and proven expertise in developing and managing assets across the commercial, hospitality, retail residential and healthcare sectors. With its core strategy of investing in and enhancing a stable of distinctive properties, OUE is committed to developing a portfolio that has a strong recurrent income base, balanced with development profits, to enhance long-term shareholder value.
OUE is the sponsor of OUE Hospitality Trust and OUE Commercial Real Estate Investment Trust.
OUE recently acquired International Healthway Corporation, a listed integrated healthcare services and facilities provider in March 2017.

 OUE after hitting the low of $1.90 on 19th May 2017, it has since bounce-off from the lower channel of the trend line and head higher to close well at $1.965 on 9th June 2017.The volume has also increased which is generally quite positive.

 
Short term wise, I think it may likely move up to rest $2.00. Crossing over with ease + good volume that may propel to drive the share price higher towards $2.06 with extension to $2.17. P/B is 0.57, dividend of 5 cents per annum.( trade base on your own decision)