Monday, April 30, 2018

Reverstone


theintelligentinvestor
Reply to clim : Yeah, the initial question from sporeshare is which counter has good earnings power


theintelligentinvestor
Reply : Don't take this as detailed analysis, just my 2c.
1) ROE > 20% for the past 5 years
2) CAGR 2013-17 - Revenue 23%, Earnings 22, Equity 18%. Healthcare glove expected to grow at 8-12% in the next 3 years.
3) Debt - CR 3, Debt/Eq 4%
4) Smallest among the 5 glove manufactures, but their EBIT is clearly superior, ie 2-4x of the other 4, Hartalega, Top Glove, Kossan & Supermax.
5) Lastly, as compared to the others in the list. Riverstone product has a bigger global market than the other that are more local or within regional.


SSJ4
Reply to theintelligentinvestor : hi tii, do u feel the pe is a tad high now?

theintelligentinvestor
Reply to @SSJ4 : Yes.
If you have noticed, I am not invested in Riverstone. Most boxes are checked, but the last & most important one (price) has not. :)


Riverstone - Riverstone Holdings Limited, an investment holding company, manufactures and distributes cleanroom and healthcare gloves under the RS brand. It also produces cleanroom finger cots, packaging bags, face masks, and wipers; and other consumables, such as hair nets, static dissipative shoes, safety booties, shoe covers, ESD rubber bands, sticky mats and rollers, swab-polyester and microfibers, antistatic gloves, static dissipative shoes, cleanroom coveralls, and cleanroom papers. In addition, the company trades in latex products; and distributes cleanroom products. Further, Riverstone Holdings Limited offers healthcare products comprising white, blue, black, and accelerator nitrile exam gloves. Its products are used in the hard disk drive, semiconductor, and healthcare industries. The company exports its products primarily to the Americas, Asia, and Europe. Riverstone Holdings Limited was founded in 1989 and is based in Singapore.

looking through their financial nos for the past few years. They are expanding and doing very well in terms of overall Total Revenue has been consistently increasing at a Compounded Annual Growth Rate of 13.96% a double digits grow of Gross revenue which is considered very good.


Gross Profit has been constantly increasing at a Compounded Annual Growth Rate(CAGR) of 20.4% from RM97.8m to RM197.8m. Gross profit margin has been maintaining above 20% at 24.2%. This is rather healthy and superb for a growing company.


Net Profit amount has been generating a high end double digits percentage of Average 18.6%.
What a spectacular achievement. The Net profit amount has seen a great improvement of RM58m from 2013 to RM 129.3m in 2017. It is growing at a CAGR of 24.58%. I would say is an outstanding achievement.


Super Healthy Cash flow generation for the past few years as can be seen from the financial results the Ops cash flow activities has been increasing from RM80.2m to RM145.7m. 


The company has a robust balance sheet of which the total borrowing is about RM25M, Cash on hand is RM114.25m, a net net position company with net cash position of RM89.25m.


Next on to their efficiency. Riverstone's return on assets (ROA) and return on equity (ROE) have maintained well from 2013 to 2017. In fact, I looked at their past trend these two return Metrics and they have maintained well at current levels of ROA (above 13%) and ROE (above 20%). We must realise that it is not easy to maintain the ROA and ROE in any business while it is growing it's assets and shareholders' equity through time. To be able to maintain the same level or even increase the level of ROA and ROE would mean the business has high efficiency. Riverstone just demonstrated their high efficiency in their businesses. If they can continue to maintain these same levels of returns, I will be even much more impressed with them.


ROA - is a measure of company profitability relative to total assets. It is calculated by dividing Tax Effective EBIT ( earning before interest and tax) by average total assets over a twelve months period.


ROE - is a measure of company profitability relative to total equity. It is calculated by dividing Tax Effective EBIT ( earning before interest and tax) by average total equity over a twelve months period.

Investor would be pleased to know that they are able to constantly increasing the paying out of the dividend over the past years as reflected on the chart below. This is a plus factor and a very pleasing way of rewarding the investor.


OUTlook:

Phase 4 expansion is now completed with seven production lines fully commissioned, bringing the Group’s total annual production capacity to 7.6 billion gloves

 Phase 5 expansion is now underway with an additional 1.4 billion pieces to ramp up total annual production capacity to 9.0 billion pieces by end FY2018

 Phase 6 expansion to add another 1.4 billion pieces by end FY2019 to 10.4 billion pieces in total annual production capacity

 Non-HDD markets for cleanroom gloves as well as US and Japan markets for both cleanroom and healthcare gloves continue to gain traction

 Continue to tap on fast-growing markets for healthcare gloves

Key Challenges

Competition • Cleanroom: Continue to target new markets and customers •

Healthcare: Focus on customised and premium products Increase in costs such as raw material, labor, and fuel •

Automation • Improve productivity using Lean Six Sigma • Reduce changeover time by installing an additional line

Investment Merits:

Continues to be in expansion mode driven by growth in both clean room and healthcare gloves – 36.8% increase in production capacity by end 2019 to 10.4 billion pieces of gloves

 Resilient balance sheet with net cash position with continued ability to generate positive operating cash flow

Consistent dividend payout since listing

Committed management team


I have roughly workout the intrinsic Ops Cash flow value of $1.25 taking into consideration the CAGR of 16.14%. Discount factor of 4%.
Let factor in the further discount of 0.85 X $1.25 = $1.06.

Dividend of 2.3 cents p.a. Yield is about 2.25%( current price of S$1.02). 
NAV of S$0.282.

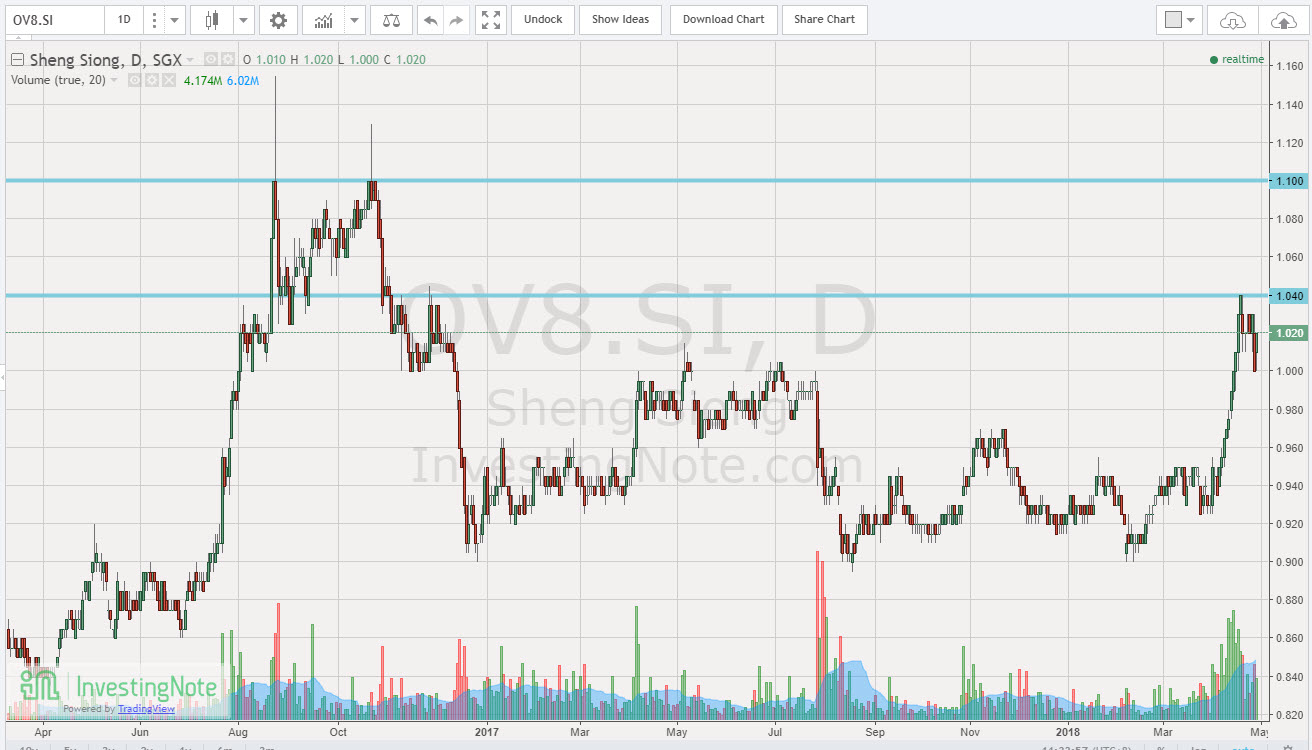
The current price of $1.02 is approaching the fair value of $1.06. Giving the fact that the company is growing and has been consistently increasing their total gross revenue and net profit level. looks like it may trade well above the fair value of $1.06. 
I think if there is any further weakness in price, i may consider to slowly accumulate.
Might be anything between 80-90 cents..That may provide a bigger Margin of Safety.


Is hard to debate how many discount factor percentage to use to calculate the intrinsic value. For this healthcare related company, rolling EPS of 5.7 cents, PE of 17.7 times seems quite attractive. Pls dyodd.
Let say the average PE for a healthcare related company might be trading around PE 22 times. We would have come out a Target Price of $1.25.


not a call to buy or sell.
dyodd. 


Venture

30th April - Venture has again turned lower by another 45 cents to close at $20.95. Looks rather shaky and critically landed on the 200 days Moving Average.


Will it be able to stay above this 200 MA or breaking down would be quite ulgy and may see further selling down pressure.

The selling volume seems to have subsided which might be a good indication that selling down pressure is slowing down .. I think a technical rebound may happen soon!


Not a call to buy or sell.

Please do your own due diligence.


 27 April - Unfortunately, Dow didn't help to safe this counter from sliding further. It is now trading near it's support level at 21 level which is quite close to it's 200 days Moving Average.


It seems to have bounce-off and staying above this 200MA. Breaking down would be super bearish!

Short term wise, it is rather oversold and may likely see a technical rebound . 20 days MA has crossed below 50 days MA, Which indicates that it is now on a downtrend mode.

Not a call to buy or sell.
Dyodd


Venture - looks like today we may likely see strong rebound after being sold down drastically for the past few days from $26.98 to a low of 19.84 before closing higher at $22.20. What an exciting roller coaster ride for both the Investor and trader . With Dow overnight closing positively due to better earnings, this counter may likely get lifted.

quote : Dow surges more than 200 points, Facebook and AMD jump after crushing earnings Facebook shares surged 9.1 percent after the company posted better-than-expected earnings and revenue for the first quarter. Advanced Micro Devices also posted earnings that topped expectations, sending its stock up about 14 percent. The strong quarterly numbers also lifted the S&P 500 and Nasdaq by 1 percent and 1.6 percent, respectively.( cnbc.com)


Yesterday, it has managed to bounce-off from the 200 days moving average and rises to close higher at $22.20. This is a short term reaction whereby Bull is taking control of the Bear.


Immediate resistance will be at $24.00 or $24.38 which is coincide with 100 days moving average. Breaking out of this level with great volume, that may drive the price higher towards testing the 50 days moving average at $27.00/

 not a call to buy or sell. please do your own due diligence.


Venture Corporation Limited, together with its subsidiaries, provides technology services, products, and solutions in the Asia Pacific. The company operates through Electronics Services Provider, Retail Store Solutions and Industrial, and Components Technology segments. It offers manufacturing, product design and development, engineering, and supply-chain management services to the electronics industry. The company also designs, manufactures, assembles, distributes, and trades in electronic, mechanical, and computer related products and peripherals; manufactures and sells terminal units; develops and markets color imaging products for label printing; designs, integrates, and trades in electronic security systems; and develops and supports information systems. In addition, it engages in the provision of manufacture, design, engineering, customization, and logistics and repair services; manufacture, design, fabrication, stamping and injection, metal punching, and spraying of industrial metal parts, tools, and dies; and design, customization, and marketing of tool-making and precision engineering solutions. Further, the company manufactures plastic injection molds and moldings with secondary processes and subassembly; and provides manufacturing services to electronics equipment manufacturers, as well as offers management services. Additionally, it imports and exports electronic parts, components, equipment, devices, and instruments. Venture Corporation Limited was founded in 1984 and is headquartered in Singapore.

SingTel

SingTel - has a very nice breaking out moment and crosses over the 100 days Moving Average at $3.49 and closed well at $3.52 , this is rather bullish!


Couple with high volume , this is generally positive and may likely continue to trend higher.

Short term wise, the bullish momentum may likely continue to trend higher towards $3.61 which is also coincide with it's 200 days Moving Average. BteakiBr out of $3.61 may likely head higher towards $3.65 then $3.70 level.


Please do your own due diligence.


Looking through the past years financial results , we can notice that singtel Total Revenue is maintaining within the range of 16.8B to 17.5B.


Fluctuation is rather small. Diluted EPS is slightly lowered from 18.2 cents to 16.7 cents.

Return Of Assets is rather Low grow at the rate of 3.65%.

Ops cash flow seems strong/pretty healthy , fluctuating between 5.25B to 5.89B.

Returnss of Equity is pretty good at 19.86%. A double digits grow.

I think Current price Seems attractive at 5.22% yield.


Not a call to buy or sell.

Please do your own due diligence .

Trade/invest base on your own decision .


Thee Singtel Group is Asia's leading communications group. We provide a diverse range of services including fixed, mobile, data, internet, TV, infocomms technology (ICT) and digital solutions. Headquartered in Singapore, Singtel has more than 130 years of operating experience and played a pivotal role in the country’s development as a major communications hub. Optus, our subsidiary in Australia, is a leader in integrated telecommunications, constantly raising the bar in innovative products and services. We are also strategically invested in leading companies in Asia and Africa, including Bharti Airtel (India, South Asia and Africa), Telkomsel (Indonesia), Globe Telecom (the Philippines) and Advanced Info Service (Thailand). We work closely with our associates, leveraging our scale in networks, customer reach and extensive operational experience to lead and shape the communications industry. Together, the Group serves over 655 million mobile customers around world. Singtel is one of the largest listed Singapore companies on the Singapore Exchange by market capitalisation. The Group has a vast network of offices throughout Asia Pacific, Europe and the USA, and employs more than 23,000 staff worldwide.

Sunday, April 29, 2018

Raffles Medical

30th April - 1st qtr result is out. Net profit is ip 3.0% from $14,965m to $15,466m.

Total revenue has also risen from $114,915m to $120,189m.
Operation cash flow has also increased from $18,175m to $23,962m.


I think the first quarter result has improved slightly in terms of revenue, total net income and as well as operation cash flow..


Raffles Medical - slowly edging higher , looks pretty encouraging / positive!

 From TA point of view, the current price of $1.17 is staying above its 20 days moving average as well as 50,100 & 200 Days MA.
This is rather bullish! MACD is also rising in a orderly manner and is looking positive to continue to trend higher.


 Short term wise, I think it may likely Re-attempt $1.21 .
 Breaking out of this Price level with ease + high volume that may propel to drive the price higher towards $1.25 then $1.30.

 Trade/invest base on your own decision.

quote : jeremyowtaip
Yeah! This one no need think so much. Long term trend in share price is up supported by general growth in domestic and medical tourism as a baseline support. The potential catalysts are the two new China hospitals which will contribute to it's earnings growth going forward. Even if the initial execution meets with hiccups, I think they will be able to work things out for the longer term as I am confident they have already done their extensive due diligence and ground studies before embarking on the new hospitals. And it is not just one but two new hospitals set up in two separate cities in China. To be able to trigger such a huge expansion project, they must have worked out that on a long term basis, the market there in China have tailwinds favouring demand for private medical healthcare. And Chongqing and Shanghai are two of the largest cities in China which are strategically located with high population and considered few of the important economic centres of China apart from Beijing.

Total Revenue has been consistently increasing from $340.99m in 2013 to $477.58m in 2017.

The Total Revenue is growing at a CAGR of 8.1%. A single digits high ,of which I think is quite good already.

 Operation cash flow has been quite healthy as they are able to generate $71.19m in 2013 to $82 .69m in 2017.

 Net income Margin has been generally declining from 24.89% to 14.82% in 2017.


It might be due to higher material /operation costs. NAV of 40.01 cents. EPS of 4 cents. PE of 27.64 times

 Dividend has been generally increasing from 1.7 cents in 2013 to 2.2 cents in 2017. This is really a welcome news for shareholder .

 For RMG, I have two possible fair values depending on how well it can execute it's new expansion and growth of it's Bugis hospital extension and also it's two China hospitals to grow it's EPS.

For the conservative fair value, it is $1.14 assuming a CAGR of 10% on it's EPS for next 7 years.

 For the more aggressive fair value, it is $1.46 assuming a CAGR of 14% on it's EPS for next 7 years. Thus, any price $1.14 and below is a bargain opportunity. not a call to buy or sell. dyodd.


Raffles Medical Group Ltd engages in the medical clinics operation and other general medical service businesses primarily in Singapore. The company operates through three segments: Healthcare Services, Hospital Services, and Investment Holdings. Its flagship hospital is Raffles Hospital, a tertiary care hospital that offers services, including emergency, cancer, children and women care, traditional Chinese medicine, counselling, dental, diabetes and endocrinology, dialysis, ear nose and throat, eye, family medicine, fertility, health screening, heart, internal medicine, international patients services, neuroscience, pain management, rehabilitation, radiology, Japanese clinic, orthopaedic, skin and aesthetics, surgery, urology, and nuclear medicine services for inpatients and outpatients. The company also operates 100 medical clinics that provide various services, such as general practice/family medicine, emergency, health check, health screening, immunization, travel health, specialty, minor surgery, X-ray, pre-marital screening, and corporate programs; provides health and related insurance; trades in pharmaceutical and nutraceutical products, and diagnostic equipment; and provides healthcare management and consultancy services, as well as specialized medical, medical laboratory, imaging center, dental, and clinical services. In addition, it owns properties; develops IT solutions; provides advisory and medical emergency assistance services; and sells medical kits. The company was founded in 1976 and is based in Singapore.

Earnings Metrics Method for Stock Selection

How to work out the current Earning yields ?

Current Earnings yield = Diluted EPS / share price (range) 


If we take the below example ..
Diluted EPS is 0.0456. Share price is 72-82 cents ) ,we shall use 82 cents as the highest price for calculating the current Earnings yield .


Current Earnings yield = 0.0456 / 0.82 = 0.055 x 100% = 5.5% . 

This is in the way higher than CPF SA if we choose to park our money there .So 5.5% is generally much higher than 4.5% .

I have glanced  through the FY 2017 result for Wilmar, diluted EPS is 0.193 .
Let's say we are taking the future share price of $3.50, that will give us a Earnings yield of 0.193/$3.50 = 5.5%.pls Dyodd.


Yes, suitable to be applied on any stocks using the current earnings yield. And once you worked that out for a few stocks you are comparing which to invest, you can decide based on all their current earnings yield whether which stock is higher in current earnings yield and also whether the fundamentals will support the growth of EPS at high compounded rate of growth or not resulting in the increase in earnings yield.
For example, for illustration purposes. let's say the current earnings yield of ABC company is 5% based on the price you paid to buy it's shares. It is able to double it's EPS in 5 years time. Then you will be having a future earnings yield of 10% on your initial investment in ABC company. A 10% earnings yield is quite good already. And if the company can continue to double it's EPS again for another 5 more years, then the future earnings yield after 10 years will be 20% on your initial investment.
And even if the company cannot grow meaningfully anymore after 10 years and just grow their EPS at a terminal growth rate of 3% thereafter in line with inflation cost, the company may now become a mature stalwart giving out a high dividend payout. At a high dividend payout ratio of 75% while only remaining 25% of earnings to be retained for some maintenance capex, the dividend yield in future for this illustrated example will be 15%. And maybe the share price would have also grown in line with the EPS growth and perhaps also quadrupled. Thus, one will be getting a multi bagger stock plus a decent high dividend yield of 15% after 10 years.


This is the best goldilocks region to be in to initially discover and invest in stocks with visible high growth prospects for the foreseeable future and buy them at high earnings yield (better done during bear markets when such goldilocks region presents both combination of cheap valuation and high growth rate of business and thus high return rate for the investor who capitalise on getting in during goldilocks timing).


What if the EPS decline instead of growing?
What action will you do?


 : That's why we want the growth prospects to be visible, the more visible the better. If any drop in eps, we have to gauge whether it is temporary or permanent. That is why we need to also constantly monitor the fundamentals of the business. If permanent deterioration in business fundamentals, we may consider to exit the investment.


Not a call to buy or sell.

Please do your own due diligence.


Trade/Invest base on your own decision .

Saturday, April 28, 2018

Sheng Siong

Sheng Siong Group’s net profit grew 6.6% yoy to S$18.3 million for 1Q2018

Revenue increased 5.1% yoy to S$228.3 million in 1Q2018 mainly contributed by new stores and comparable same store sales

 Gross profit margin improved to 26.2% in 1Q2018 from 25.2% in 1Q2017

 Continue with our efforts in expanding the network of outlets in Singapore especially in areas where our potential customers reside


Revenue increased by 5.1% yoy in 1Q2018 but excluding China, revenue from the Singapore operations grew by 4.3%. The seven new stores and comparable same store sales contributed 6.7% and 5.6% respectively to the increase in revenue, but the closure of the Verge and Woodlands Block 6A stores in FY2017 lowered revenue growth by 8.0%.


The 5.6% improvement in comparable same store sales came from the recovery in consumers’ sentiment which began in the second half of FY2017, the expansion of the store at Block 506 Tampines Central 1, pickup in sales in the Loyang store after it re-opened in February 2017 and customers migrating to the Jalan Berseh and Woodlands Block 301 stores after the closure of the Verge and Woodlands Block 6A stores respectively.


EPS rises from 1.14 to 1.22 cents . An increase of 6.1% . Another set of good result.

Gross margin improved to 26.2% in 1Q2018 compared with 25.2% in 1Q2017, mainly because of a higher sales mix of fresh products which command a higher gross margin versus non-fresh products, and suppliers’ rebates as a result of marketing efforts. Consistent with seasonal trends, gross margin was lower than 4Q2017’s gross margin of 26.5%, as the industry tends to push for volume during the Chinese New Year festive season


Administrative expenses increased by S$4.0 million in 1Q2018 compared with 1Q2017 but excluding China, the increase attributable to Singapore operation was S$3.6 million. After deducting an adjustment of S$0.5 million reclassified from cost of sales in 1Q2017, the increase was S$3.1 million. The increase was mainly because of the increase in staff cost due to more headcount needed to operate the new outlets, higher provision for bonus because of better financial performance, increase in depreciation as well as increase in rental because of the seven new stores opened during August 2017 to 31 March 2018.


 Cash generated from operating activities before working capital changes and payment of tax amounted to S$25.8 million in 1Q2018, which is in line with the higher level of activities. Free cash flow of S$5.1 million was generated in 1Q2018, after paying for capital expenditures amounting to S$9.2 million consisting mainly of payments for the construction of the warehouse extension of S$2.0 million, renovation to the new outlets and purchase of IT and other equipment for Singapore’s supermarket operation totalling S$6.1 million, maintenance capital expenditures of S$0.3 million for the distribution centre in Mandai and capital expenditures of S$0.8 million relating to the supermarket in Kunming, China.

The Group’s balance sheet remained healthy with cash of S$78.6 million as at 31 March 2018.

Business Outlook 

The industry is expected to remain competitive. Besides competitive pressures, gross margin would be affected if input cost is increased because of food inflation which could be caused by disruption to the supply chain or changes to prices caused by nations imposing trade tariffs.

The Group has successfully bid for two new stores at Bukit Batok Block 440 (5,900 sq. ft) and Yishun Block 675 (5,320 sq. ft). Subject to the grant and execution of the leases with the HDB, these two new stores should be operational in 2Q2018. The Group will continue to look for retail space in areas where our customers reside and will continue to bid, in a rational manner for new HDB shops in re-developed and new neighbourhoods, and at the same time look for retail space in existing HDB estates where the Group does not have a presence.


The Group will continue to nurture the growth of the new stores, rejuvenate the old stores and build on the lessons learnt from the e-commerce project.

 The Group will promote the “Sheng Siong” brand in Kunming China through the operations of the supermarket and is mindful that brand building requires time.

(http://infopub.sgx.com/FileOpen/SSG_1Q2018_MediaRelease_27Apr2018.ashx?App=Announcement&FileID=501782)

looking through the Financial numbers for the past 5 years, diluted EPS is slowly increasing but at a low single digit diluted EPS.


I have worked out the Potential Earnings Yield = diluted EPS / share price

Potential Future Earnings Yield = 0.04 ( much higher than 3.5 cents indicated on the financial nos / 1.05 = 0.04 x 100% = 3.8% which is much lower than the CPF SA.

I think investor may want to wait for a good a lower price when the yield has fallen to minimum 4.5% and above.

not a call to buy or sell.
Please do you own due diligenct.

Trade/invest base on your own decision.

TA wise, looks bullish !

Looks like it may likey re-capture $1.04 and trend higher towards $1.10.